The goal of this project is to analyze the demographics of donors to a non-profit in West Michigan with Python. Demographic data was acquired from the U.S. Census Bureau’s American Fact Finder, donor data through my geocoding project, and the shapefiles were found through the Census’s TIGER shapefiles. I looked for the following data:
- Median Household Income in the Past 12 Months (a widely accepted measure of income)
- Age and Gender
- Educational Attainment
First, I imported the relevant modules and set the current working directory:
Next, the spreadsheets are turned into a pandas dataframe and the column headers are dropped.
There are only certain columns that I am interested in for each spreadsheet. All other columns are dropped through this function (columns were determined manually).
After the demographic data is formatted correctly, it can be joined with the shapefile of census tracts.
In order to perform demographic analysis on the non-profit donors, the spreadsheet must be turned into a geopandas GeoDataFrame. This is done by reading in the spreadsheet, dropping any rows that were unsuccessfully geocoded, and then converting those columns into a Shapely Point object. Now that the dataframe has a correctly formatted geometry column, it can be converted into a GeoDataFrame.
The donors and demographics can then be spatially joined into one GeoDataFrame. The end result will be donors in Michigan (this is where a large majority of the donors are).
ANALYSIS
I used the pygal library to make the following graphs. These graphs give a general impression of the non-profit donors and should be weighted according to where the donors are located. For example, if a large share of donors live in Ottawa County, their information will be weighted more heavily than the one donor in Oscoda County.
Income Groups
Educational Attainment in Ages 25 and Over
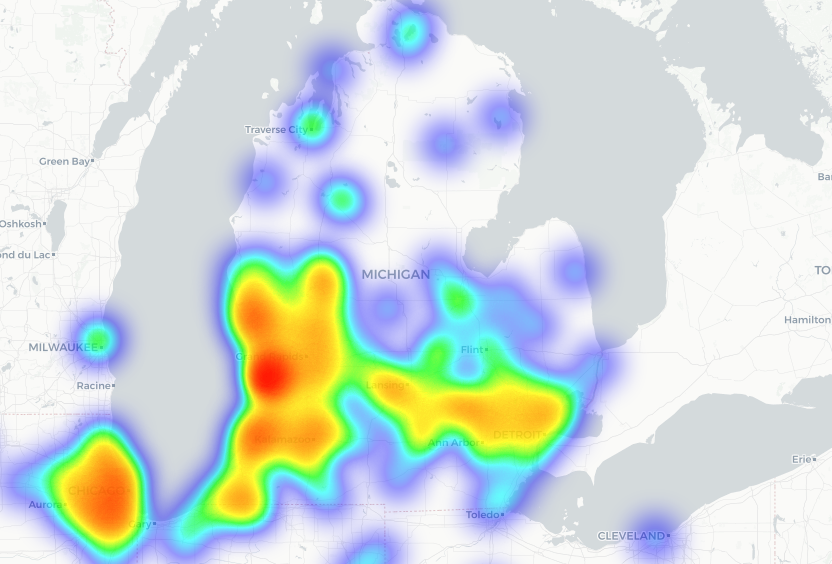
Finally, a heatmap is made with the Python library folium. This library allows Leaflet webmaps to be made from Python.