Due to Heroku ending their free-tier, this website is no longer live. I hope to find another host for this website.
The City of Grand Rapids, with data available since 2004, has handled code compliance and building cases originating internally and from the public. At the time of this writing, the number of cases started is fast approaching 300,000 cases.
Interestingly enough, there is no means to view this data spatially. That is why I built a mapping interface. I aim to update this data at least once a week.
If you would like to learn about the implementation of this web app, please read on. If not, then you can find the Code Compliance map here. Please be patient as the data loads.
Note: this does not work on Android and probably does not work on iOS. Please use your computer. It is likely too much data for your phone to handle, so your mobile browser will crash.
Data Preparation
First, I needed parcel data for the City of Grand Rapids so I could later join the case data with parcels by a shared attribute: their parcel number. Data was acquired from Kent County’s excellent data library.
<img src="before-clip.png" alt="Snow" style="width:100%"><img src="after-clip.png" alt="Forest" style="width:100%">The parcels, as shown in the left image above, needed to be clipped to the City’s actually boundary. This was accomplished via Python’s geopandas library. Moreover, the script below exports the centroid of each parcel since I will want to represent each case in the middle of a parcel.
Data Scraping and Upload
All of the data in this project are open to the public, it is just not in an easily consumed format (e.g. a spreadsheet). Well, technically you can search for all properties on the City’s Accela portal, but you will have no luck trying to download all the results (the spreadsheet is too large).
That is why I turned to scraping the data via Python. More specifically, I utilized Selenium to enter date values and download results.
The original script broke down queries by month increments, from 2004 to 2020, and downloaded the results. To download ~300,000 records in this manner took 30 minutes. It would have taken much longer without utilizing multiprocessing.
Subsequent runs of the script simply start where the last run of the script left off. With every new run, older cases are updated, data is cleaned, and scraped data are joined with the parcel centroid. All of this data are then manually uploaded to AWS S3, and a stripped down version is uploaded to CARTO (which I will talk more about later).
You can view both my scraping script and data cleaning script on GitHub.
Mapping Interface
The mapping interface was built primarily with Flask and Mapbox GL JS. The project layout for Flask was inspired by Miguel Grinberg’s Flask Mega-Tutorial.
Flask is used for serving up web pages and returning data from user POST requests (e.g. updating status filters if the case type changes, querying PostgreSQL to see if a report is done, making a request for a report).
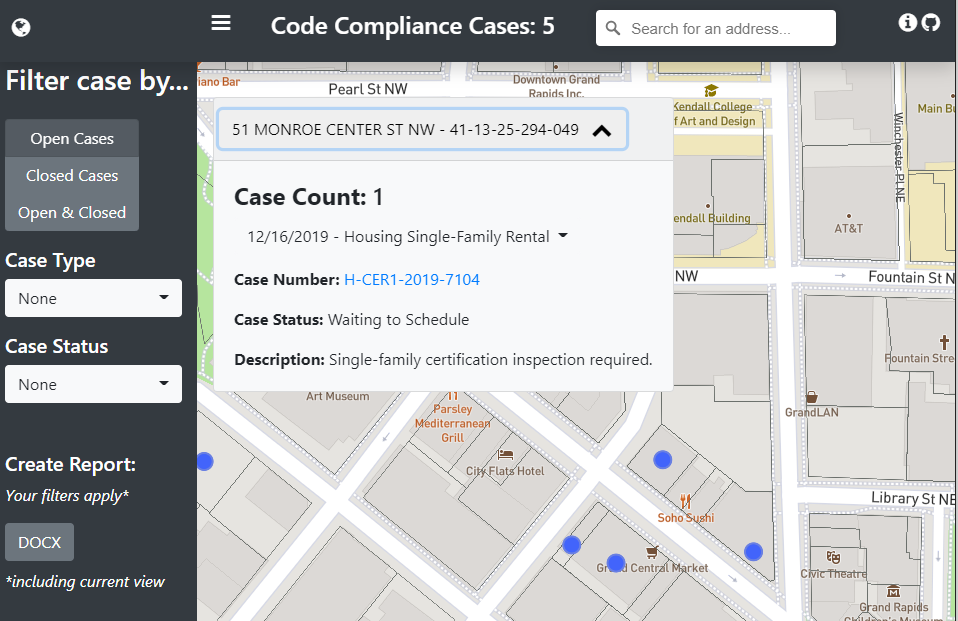
Mapbox GL JS does the work of visualizing the data. Moreover, it is responsible for the case counts, filtering, and pop-ups.
I won’t go into detail on all of the code (you can view this project on GitHub), but the popups are populated by querying rendered features, determining which points are inside the polygon with turf.js, and then inserting that array of cases into the pop-up.
Hosting the Web Application
This web application is hosted on Heroku. The free plan will let you host a website for free. The only downside for the free plan is that this app can “fall asleep”. Basically, if it remains inactive for 30 minutes, it will go to sleep. Any website launches that “wake-up” the app results in a long loading time.
Heroku’s free plan allows me to host a web page via their web worker, and to have a background script running with a 2nd worker. It also comes with a free 10,000 rows in a PostgreSQL database. Both the 2nd worker and the database came in handy for the reporting aspect of this project.
Reporting
I thought it would be nice to let the user have the ability to create a report based on their filters and current view. The basic workflow of the reporting is as follows:
- User requests report, filter parameters & current view are recorded in the database
- Background script makes request every 10 seconds to see if new reports have been requested
- If new report is requested, a new report is created, and a message is sent back to the client that their report is ready
- Report is noted as “Ready to download” and the Word Document is sent to the client
There were more obvious avenues I could have taken for the reporting, but their convenience was outweighed by their potential failure (or cost). For example, I could have used something like Celery or Redis for managing task queues, but I think the costs would have been prohibitive (for a project that I am mostly trying to keep free). I could have also just processed the report within the Flask application, but if I did not return any result within 30 seconds, the application would crash.
My favorite part of the reporting logic is its use of CARTO and PostgreSQL/PostGIS. Seeing as how I could not load all of the json data from AWS in memory (I kept getting memory errors), I had to pull in the data from CARTO via their SQL API. Here is a bit of an example of what the query construction actually looks like:
CARTO’s SQL API was quite helpful because it allowed me to pull in just summaries of the data, not all of it, thus avoiding any memory issues. It also takes advantage of PostGIS functions (like ST_WITHIN) to query cases inside of the user’s view.
Again, you can find this project on GitHub. Thank you for reading.