This project uses data from American Forests and explores the correlation between certain health metrics and tree cover in a given census tract.
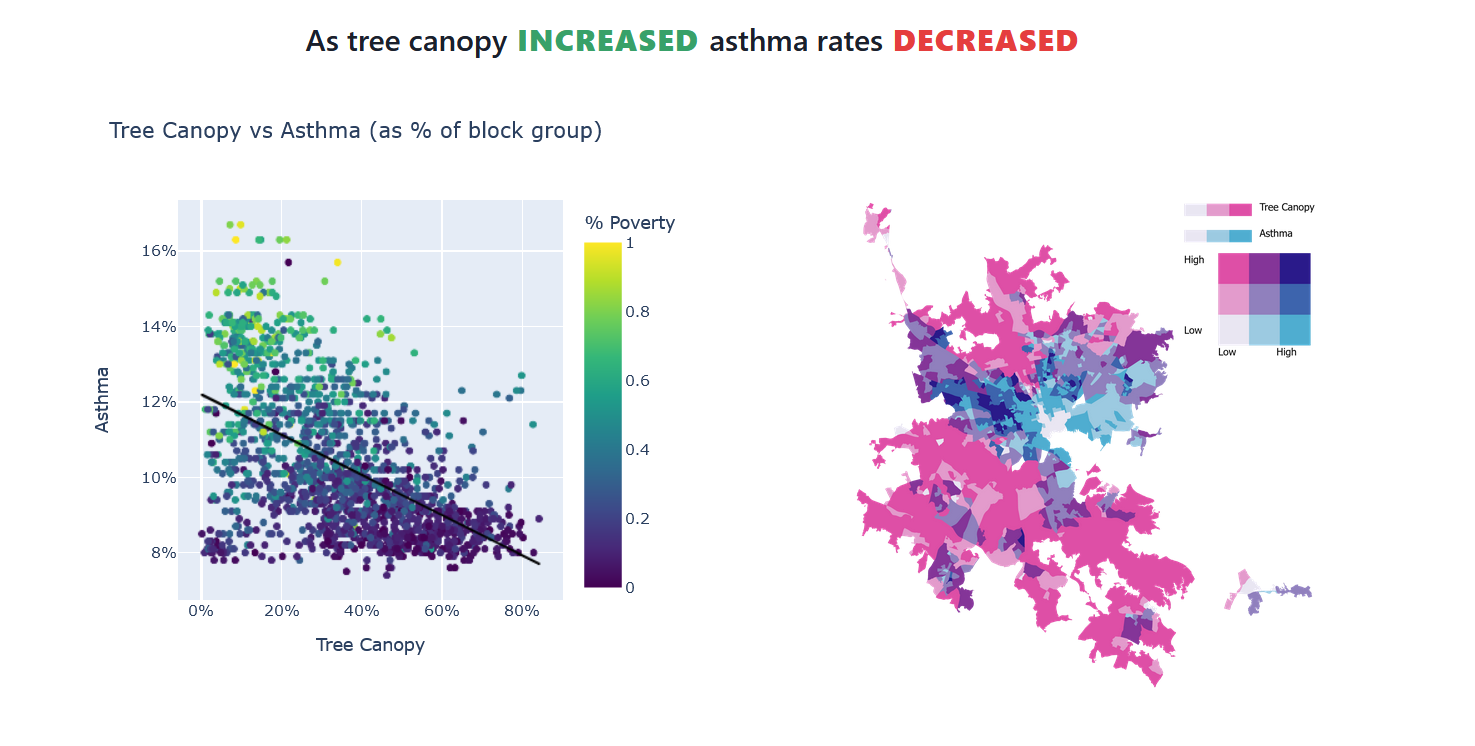
Graphs were made with plotly in Python, and the bivariate maps were created in ArcGIS Pro. Click here to see the full data exploration.